



Introduction: A Depot Moment, Some Figures, and a Question
I remember standing in a cold Edinburgh depot at dawn, watching drivers swap keys and stare at idle buses as the clock ticked on. In that quiet, you notice the details — how long it takes to plug in, how the schedule slips. The pantograph charger sat above, a simple metal arm waiting to kiss the roof (aye, exactly like that), and I wondered how much of the delay was avoidable. Recent studies show overhead pantograph systems can cut charge time dramatically for high-use routes — but why do some depots still struggle with them? This piece will walk through that question and point to what matters next.
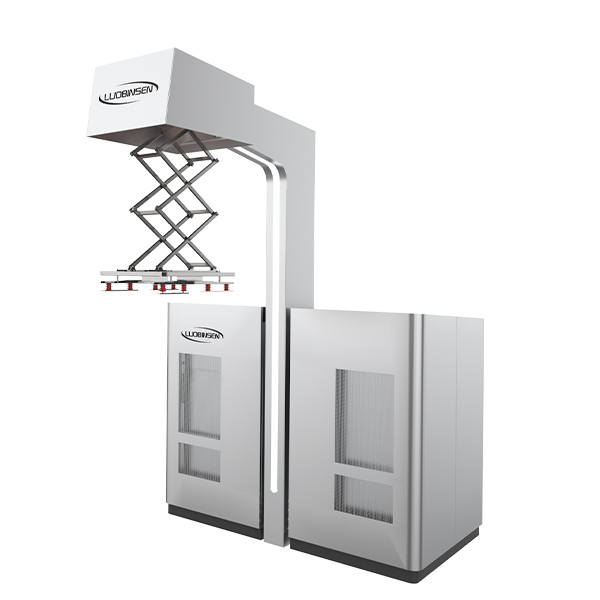
Beneath the Surface: Where the pantograph bus charger Fails Drivers and Technicians
pantograph bus charger — that’s the phrase you hear in tender docs and at conferences. Yet when I talk to technicians and fleet planners, the complaints keep surfacing. Faulty contact strips, inconsistent pantograph controller logic, and mismatched power converters are regular gripes. These are not just jargon; they are the daily friction points that lengthen dwell times and raise maintenance bills. Look, it’s simpler than you think: a misaligned overhead collector means a failed connection and a lost charging window. I’ve seen it myself — buses queuing while staff fiddle with alignment settings.
What exactly trips things up?
First, the mechanical tolerances. A pantograph needs precise motion control. If a contact strip wears unevenly, the current flow drops and the charger trips. Second, communication gaps. The pantograph controller must talk cleanly to the vehicle’s battery management system. When signals lag, charging ramps are conservative, and you lose minutes each time. Third, infrastructural mismatch: depot power systems and DC charging modules sometimes weren’t planned together. Power converters underperform when fed from weak feeders, and that cascades into slower charging sessions. These are real pain points for people on the ground; technicians curse them at 3 a.m. — funny how that works, right?
Looking Forward: Principles for Better Pantograph Systems
We need to move from fixing symptoms to reworking principles. For me, the future of the pantograph for electric bus lies in three clear technical directions: resilient mechanical design, smarter control logic, and integrated power architecture. Start with robust mechanical guides that reduce alignment error. Add closed-loop control in the pantograph controller so the arm adapts to bus roof height and tilt in real time. Finally, design the power converters and depot distribution together, not as afterthoughts. When those three things line up, the system behaves predictably. Systems that do this already show quicker turnaround times and lower fault rates.
Real-world Impact — what changes on the road?
I’ve visited a small city depot where they upgraded alignment guides and rewrote controller firmware. The result: fewer manual interventions, and buses left on schedule far more often. Ridership improved because reliability matters to passengers. It’s not magic — it’s engineering and good planning. — and yes, that matters. If you’re planning a fleet rollout, think holistically: vehicle interface, depot power, software, and staff training. Those pieces interact; neglect one and the whole system suffers.
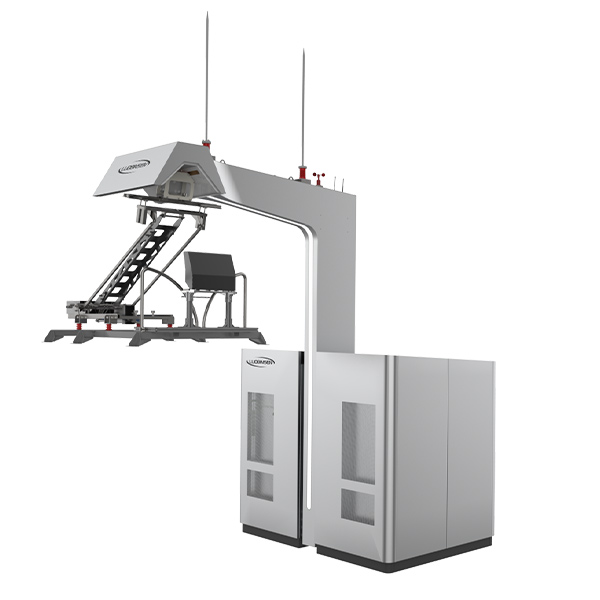
Choosing the Right Solution: Three Metrics I Trust
To wrap up, here are three simple metrics I use when evaluating pantograph systems. First: mean time to connect (MTC). How long, on average, from arrival to active charging? Shorter is better. Second: contact reliability rate. Track successful connects per 1,000 attempts; if that number dips, you’ll see schedule slippage. Third: integrated power efficiency. Measure energy lost between the depot feed and the battery — lower loss means faster, cheaper charging. Use these metrics together. They tell you where to invest: mechanical fixes, firmware, or power upgrades. I’ve applied this checklist at depots and it points straight to the highest-impact fixes.
We’re moving toward smarter depots and smoother services. I believe the pantograph model will keep improving as OEMs and grid planners learn to speak the same language — and as technicians get the right tools. For practical equipment and support, consider what established suppliers offer and test for the metrics above. If you want a starting point for hardware and system design, see how suppliers like Luobisnen present integrated pantograph solutions — they’re not a miracle, but they show what coordinated design can do.